Interactive Digits Labeling
Example file: examples/label_digits.py
This example simiulates the use case where you want to humane to assign label to active learning algorithm selected samples. We uses the digits dataset provided by scikit-learn. Each time a sample is selected by active learning algorithm, the sample (a written digit) will be shown on the screen. The user will have to enter the corresponding digit to the command line to finish the labeling process.
The useage is roughly the same as the plot.py example.
1 2 3 4 5 6 | # Give each label its name (labels are from 0 to n_classes-1)
lbr = InteractiveLabeler(label_name=[str(lbl) for lbl in range(n_classes)])
for i in range(quota):
ask_id = qs.make_query()
print("asking sample from Uncertainty Sampling")
|
The difference is that the labeler is replaced by
InteractiveLabeler, which opens the digit image for human labeler
to see and receive the answer from command line.
Here are a snapshot of this example:
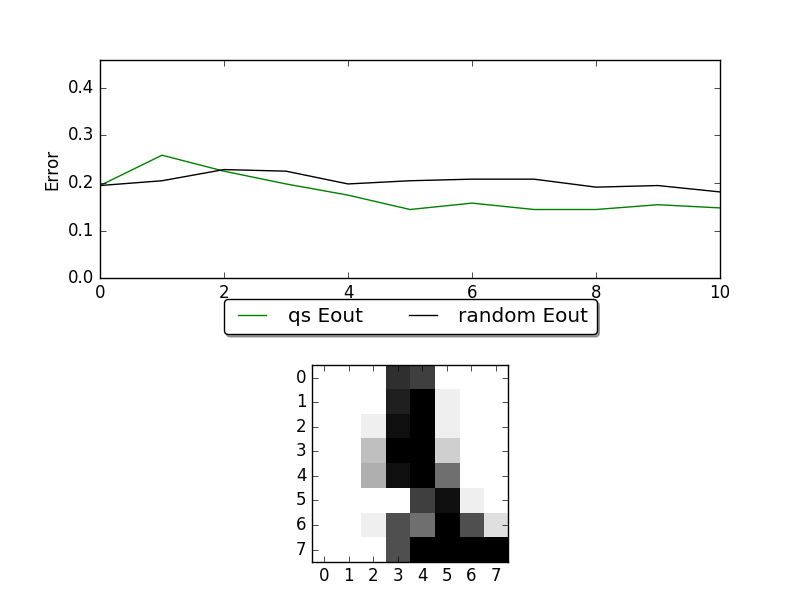
The figure on the top is the learning curve of ucertainty sampling and random sampling. X-axis is the number samples of queried, and Y-axis is the corresponding error rate. The figure on the button is the sample that human should assign label to.
Full source code:
1 2 3 4 5 6 7 8 9 10 11 12 13 14 15 16 17 18 19 20 21 22 23 24 25 26 27 28 29 30 31 32 33 34 35 36 37 38 39 40 41 42 43 44 45 46 47 48 49 50 51 52 53 54 55 56 57 58 59 60 61 62 63 64 65 66 67 68 69 70 71 72 73 74 75 76 77 78 79 80 81 82 83 84 85 86 87 88 89 90 91 92 93 94 95 96 97 98 99 100 101 102 103 104 105 106 107 108 109 110 111 112 113 114 115 116 117 118 | #!/usr/bin/env python3
"""
This script simulates real world use of active learning algorithms. Which in the
start, there are only a small fraction of samples are labeled. During active
learing process active learning algorithm (QueryStrategy) will choose a sample
from unlabeled samples to ask the oracle to give this sample a label (Labeler).
In this example, ther dataset are from the digits dataset from sklearn. User
would have to label each sample choosed by QueryStrategy by hand. Human would
label each selected sample through InteractiveLabeler. Then we will compare the
performance of using UncertaintySampling and RandomSampling under
LogisticRegression.
"""
import copy
import numpy as np
import matplotlib.pyplot as plt
try:
from sklearn.model_selection import train_test_split
except ImportError:
from sklearn.cross_validation import train_test_split
# libact classes
from libact.base.dataset import Dataset
from libact.models import LogisticRegression
from libact.query_strategies import UncertaintySampling, RandomSampling
from libact.labelers import InteractiveLabeler
def split_train_test(n_classes):
from sklearn.datasets import load_digits
n_labeled = 5
digits = load_digits(n_class=n_classes) # consider binary case
X = digits.data
y = digits.target
print(np.shape(X))
X_train, X_test, y_train, y_test = train_test_split(X, y, test_size=0.33)
while len(np.unique(y_train[:n_labeled])) < n_classes:
X_train, X_test, y_train, y_test = train_test_split(
X, y, test_size=0.33)
trn_ds = Dataset(X_train, np.concatenate(
[y_train[:n_labeled], [None] * (len(y_train) - n_labeled)]))
tst_ds = Dataset(X_test, y_test)
return trn_ds, tst_ds, digits
def main():
quota = 10 # ask human to label 10 samples
n_classes = 5
E_out1, E_out2 = [], []
trn_ds, tst_ds, ds = split_train_test(n_classes)
trn_ds2 = copy.deepcopy(trn_ds)
qs = UncertaintySampling(trn_ds, method='lc', model=LogisticRegression())
qs2 = RandomSampling(trn_ds2)
model = LogisticRegression()
fig = plt.figure()
ax = fig.add_subplot(2, 1, 1)
ax.set_xlabel('Number of Queries')
ax.set_ylabel('Error')
model.train(trn_ds)
E_out1 = np.append(E_out1, 1 - model.score(tst_ds))
model.train(trn_ds2)
E_out2 = np.append(E_out2, 1 - model.score(tst_ds))
query_num = np.arange(0, 1)
p1, = ax.plot(query_num, E_out1, 'g', label='qs Eout')
p2, = ax.plot(query_num, E_out2, 'k', label='random Eout')
plt.legend(loc='upper center', bbox_to_anchor=(0.5, -0.05), fancybox=True,
shadow=True, ncol=5)
plt.show(block=False)
img_ax = fig.add_subplot(2, 1, 2)
box = img_ax.get_position()
img_ax.set_position([box.x0, box.y0 - box.height * 0.1, box.width,
box.height * 0.9])
    # Give each label its name (labels are from 0 to n_classes-1)
    lbr = InteractiveLabeler(label_name=[str(lbl) for lbl in range(n_classes)])

    for i in range(quota):
        ask_id = qs.make_query()
        print("asking sample from Uncertainty Sampling")
# reshape the image to its width and height
lb = lbr.label(trn_ds.data[ask_id][0].reshape(8, 8))
trn_ds.update(ask_id, lb)
model.train(trn_ds)
E_out1 = np.append(E_out1, 1 - model.score(tst_ds))
ask_id = qs2.make_query()
print("asking sample from Random Sample")
lb = lbr.label(trn_ds2.data[ask_id][0].reshape(8, 8))
trn_ds2.update(ask_id, lb)
model.train(trn_ds2)
E_out2 = np.append(E_out2, 1 - model.score(tst_ds))
ax.set_xlim((0, i + 1))
ax.set_ylim((0, max(max(E_out1), max(E_out2)) + 0.2))
query_num = np.arange(0, i + 2)
p1.set_xdata(query_num)
p1.set_ydata(E_out1)
p2.set_xdata(query_num)
p2.set_ydata(E_out2)
plt.draw()
input("Press any key to continue...")
if __name__ == '__main__':
main()
|